You’re reading this because you’ve got an incredible piece of research or data project that you’ve been working on for a long time. You’re excited by the findings and are scouring the internet for ways to present this data in an engaging and digestible format.
You could choose to package it up via the traditional method of locating a fancy PowerPoint template and then copying over the key findings. This works. But depending on the resources you have available in terms of artwork, designers and data extrapolation experts you may struggle to do your project the justice it deserves.
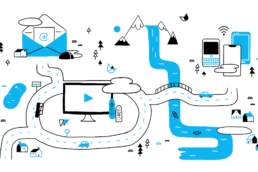
There is another way. A way that doesn’t require you to fiddle around on design programmes or send angry emails to colleagues needing image files in a PNG format. We like to call it an animated report.
An animated report looks at how to present data and conceptualises it into a free flowing, smoothly moving animation that will blow the socks off of those watching it. Be it key stakeholders, potential customers or the big boss – an animated report will wow your audience and provide a truly innovative way of displaying your key findings or data.
But how does it work?
Display Data Quickly But Efficiently
The real strength of an animated report is how it presents data rapidly but in an easy to follow and absorb format. Think about a PowerPoint presentation, it doesn’t really move. If it does you’ve probably used some PowerPoint’s stock animations, that aren’t likely to impress or engage your audience.
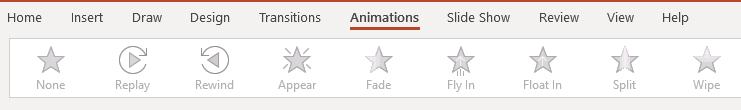
(Big fan of ‘Fly In’ here at TAG HQ)
To show you an example of how data can be displayed in a rapid but efficient manner we refer you to a case study we worked on with Timberland. The following video is barely over one minute long but neatly illustrates a whopping eight stats and key messages without feeling rushed.
Remove The Need To Present At All (Sort of)
One benefit of an animated report that goes under the radar is how it can remove the need to even present at all. What we mean by this is you can plan how you want to approach the presentation of your project/data.
Firstly, as most people do, you can opt to include a professional voice over in your animated report. A professional voice over adds a nice touch to the report as it offers authenticity and direction to where you are trying to lead your viewers. It also ensures the sound quality is crisp, loud and the voice actor fits with the theme of your video. So if you’re trying to explain quantum theory, consumer behaviour or simply illustrate sales of a new line of trainers, we have the voice actor for you.
If you don’t want to go down the professional route and fancy yourself as a star then be our guest! Some organisations like to add real authenticity to their animated reports and have key members of staff or people directly involved in the project voice over key messages. This not only adds a personal touch but also allows the presenter some time to ensure they can enunciate different words at the right time and removes any concerns about stage fright or not hitting the right spots when the lights come on.
Take a listen to example below for Atkins concerning London Heathrow Airport and listen to how the voice actor carefully leads the video and is able to use intonation to the benefit of the videos overall message.
Masterfully Represent Your Brand
You’ve collected the data and now it’s time to incorporate your brand guidelines. An animated report allows you to present data that takes into account all of your key brand messaging. From fonts to colours to line spacing and logos, all can be added into the mixing cauldron to ensure your data and findings visually depict your brand.
As masters of brand guidelines we were thrilled to partner with the Coca-Cola Research Council to produce an animated report that presented their key findings. Working closely with them we worked diligently to match their strict guidelines and produce a finished product that lived up to their worldwide brand presence.
Want To Transform Your Data Presentation?
If you are still wondering how to present data in the most engaging and impactful way possible then please do get in touch. We’d love to discuss your project with you and can help with direction and ideas from previous projects that we’ve worked on. You can call us on 0207 2886 319 or email us at wecanhelp@theanimationguys.com
Error: Contact form not found.
The Animation Video Workbook

The 1-stop shop for everything you need to know about making the most awesome video possible